Application Monitoring
The application monitoring console page displays the current system status of Distribution Engine and its four major running components: The scheduler , responsible for distributing records. The heal…
The application monitoring console page displays the current system status of Distribution Engine and its four major running components:
- The scheduler, responsible for distributing records
- The health checker, responsible for recovering other components of Distribution Engine in the event of an error
- The classifier, which can process records and assign them territories, or performing lead matching and autoconversion
- Object Sync, which can ensure that children of assigned objects are updated to the same owner as their parents.
This page can be used as a general indicator of system status, displaying whether the system is running, and if any major problems have been encountered.
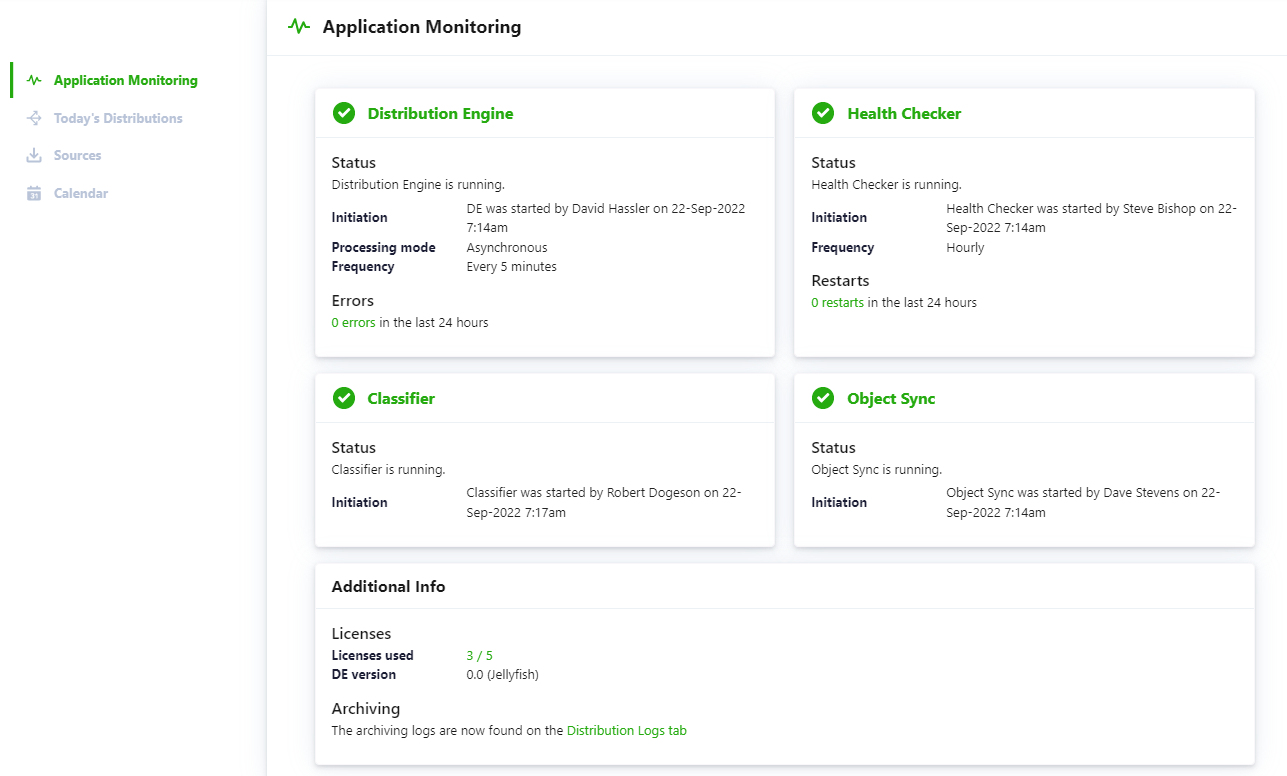
Component Information
Status : This displays the current state of the component:
| Not Configured | If Classifier or Object Sync have not been configured for use, no icon will be displayed. | |
 | Not Running | The component has been configured, but is not currently running. | |
 | Running | The component is running without major issues | |
 | Running with Warnings | The component is running, but there are some issues that need addressing. The warnings will be displayed in the component area. | |
 | Errored | The component failed to run due to an error. The error details will be displayed in the component area. |
Initiation: For running components, this shows which Salesforce User started the component, and when they started it.
Processing Mode: Displayed on the scheduler and component while the scheduler is running, this shows the processing mode in use.
Frequency: Displayed on the scheduler and health checker components while running, this shows how often the component is running. This is configurable from advanced settings.
Errors: Displays how many scheduler errors have occurred in the past day . Clicking the number of errors links through to the scheduler logs page.
Restarts: Displays how many components health checker has restarted in the past day . Clicking the number of errors links through to the scheduler logs page.
Additional Info
The additional info section displays some general information about Distribution Engine on your org.
Licenses: This displays how many licenses are used out of the total number of licenses assigned to your org. Clicking this takes you to the licensed users page.
DE Version: This displays the version number of distribution engine, and the named milestone release.
Expiry Date: If your Distribution Engine license is due to expire soon, for example if you are on a trial or if you have recently cancelled,
Licensed Running User Warning; If one of the running users for the components is missing a managed package license, this will be displayed in the Additional Information section.
How did we do?
Console Introduction
Today's Distributions